Wenda Chu, Minsi Lu, Botian Wang, Sihang Zeng, Shiyu Zhao
Repo: PPI Network Guided Driver Target Discovery
Introduction
With the development of high-throughput biological sequencing techniques, single-cell data are becoming an important data modality in the field of bio-informatics and data mining. In this project, we focus on the problem of driver target discovery using single-cell RNA-seq data. The problem of target discovery aims to mine possible gene targets for a specific disease, and is a fundamental task for drug design and pathway discovery. In this project, the input of the target discovery framework is a given list of known disease targets and the single-cell RNA-seq data matrix, and the output is a list of predicted new driver targets. Additionally, the protein-protein interaction (PPI) data are leveraged in our framework to model the relationships between genes, which proves to be helpful for the discovery of potential targets.
Method
Our key motivation is that genes in the same pathway should be close together in the embedding space to find more potential targets near known targets in the embedding space. Note that the PPI graph contains interactions between proteins (genes), including shared function, binding, activation, and inhibition, which incorporates important pathway information for various diseases. Hence, we choose to use a PPI network to add constraints on the gene embedding space.
Framework
Our overall framework is presented in the figure below. Firstly, we use sc-ETM as the gene feature extractor. The training of sc-ETM is regularized by an extracted PPI network. Then, the gene embeddings are fed into the target score regression head, which outputs a score for each possible target. After sorting the results and selecting the top k targets, we obtain a list of the predicted gene targets.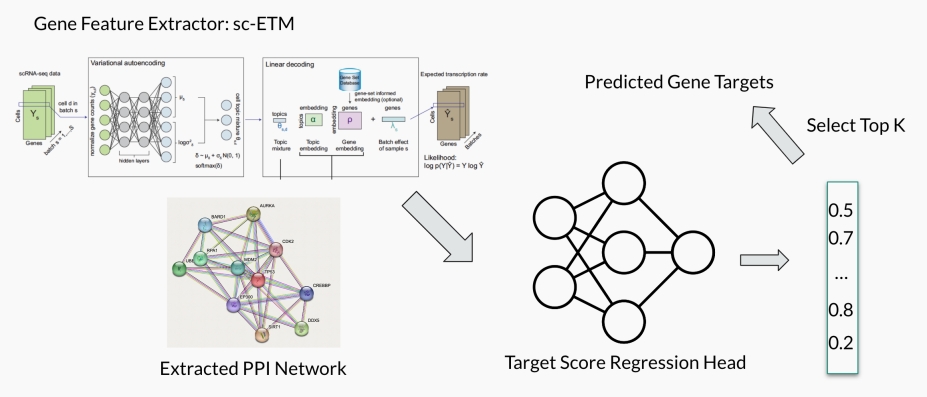
PPI Network Construction
We download the PPI network of homo sapiens from STRING 11.5 database. After filtering with genes in the RNA-seq dataset, we obtain 6184316 PPI links among 12015 genes and construct an undirected graph as our PPI network. Each PPI link is defined as $(u, e, v)$, where $u, v$ are two genes (proteins) and $e$ is the confidence score of the interaction between $u, v$.
Regularization on PPI
Following the intuition that genes with strong biological correlation should be mapped to similar vectors in the embedding space, we introduce a regularization loss to inject biological information into the gene embedding. Let $G = (V, E)$ be the graph of a PPI network, each edge $e = (u, v)$ of which is assigned with weight $w_e$ representing the strength of biological correlation between two genes. Our regularization loss $L_{reg}$ computes a weighted sum of squared $\ell_2$ distances between all gene pairs. The gene pairs with stronger correlation according to the PPI network have a larger weight we, so they are guided to be mapped closely in the embedding space.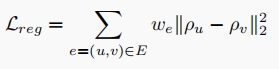
where $\rho_u, \rho_v \in R^d$ are the gene embedding of $u$ and $v$, respectively. We combine the regularization loss with the original ELBO loss function from sc-ETM to train our model.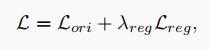
where $λ_{reg}$ is a hyper-parameter, chosen to be 1e-2 in our experiments.
Result
Dataset
sc-RNA seq: Glioma transcriptional Cells (GBM, IDH-MUT)
- Glioma is a type of tumor that occurs in brain and spinal cord
- Single-cell data: 948 cells * 12916 genes
- RNA expression matrix provided by Chaligne et al., which comprises of data from the IDH-mutant and IDH-wildtype glioblastoma.To our best knowledge, there lacks mutant-specific target data for glioma in existing databases, so we only use the IDH-wildtype cells for the target discovery task.
Target Dataset: Open Target Platform Dataset
- 7751 Glioma targets with target scores
- 4699 overlapping genes with GBM
Train / Valid / Test : 8/1/1
Clustering Performance
We evaluate the performance of clustering on the embeddings to verify the effectiveness of PPI network guidance. We follow the evaluation metric of the original paper and use Leiden to cluster cells by their cell embeddings. During the clustering, we tried multiple resolution values and reported the result with the highest ARI and NMI for each method. The results are as follows: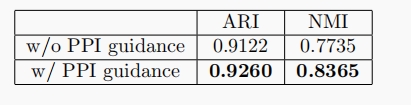
We also visualize the clustering results in Figure 2. The figure on the left-hand side is the clustering result with the highest ARI and NMI(the number of labels is not designated). As illustrated, the best clustering result without PPI guidance corresponds to two labels, while that with PPI guidance corresponds to three labels, which is the true number of labels.
Besides, the figure on the right-hand side is the clustering result given the true number of labels. In the original model without PPI guidance, the 0.0(blue) cluster and 1.0(yellow) cluster are close to each other and are not separated well, while in the model with PPI guidance, all of the three clusters are well separated: 0.0(blue) cluster on the left top, 1.0(yellow) cluster on the right bottom, and 2.0(green) cluster in the middle.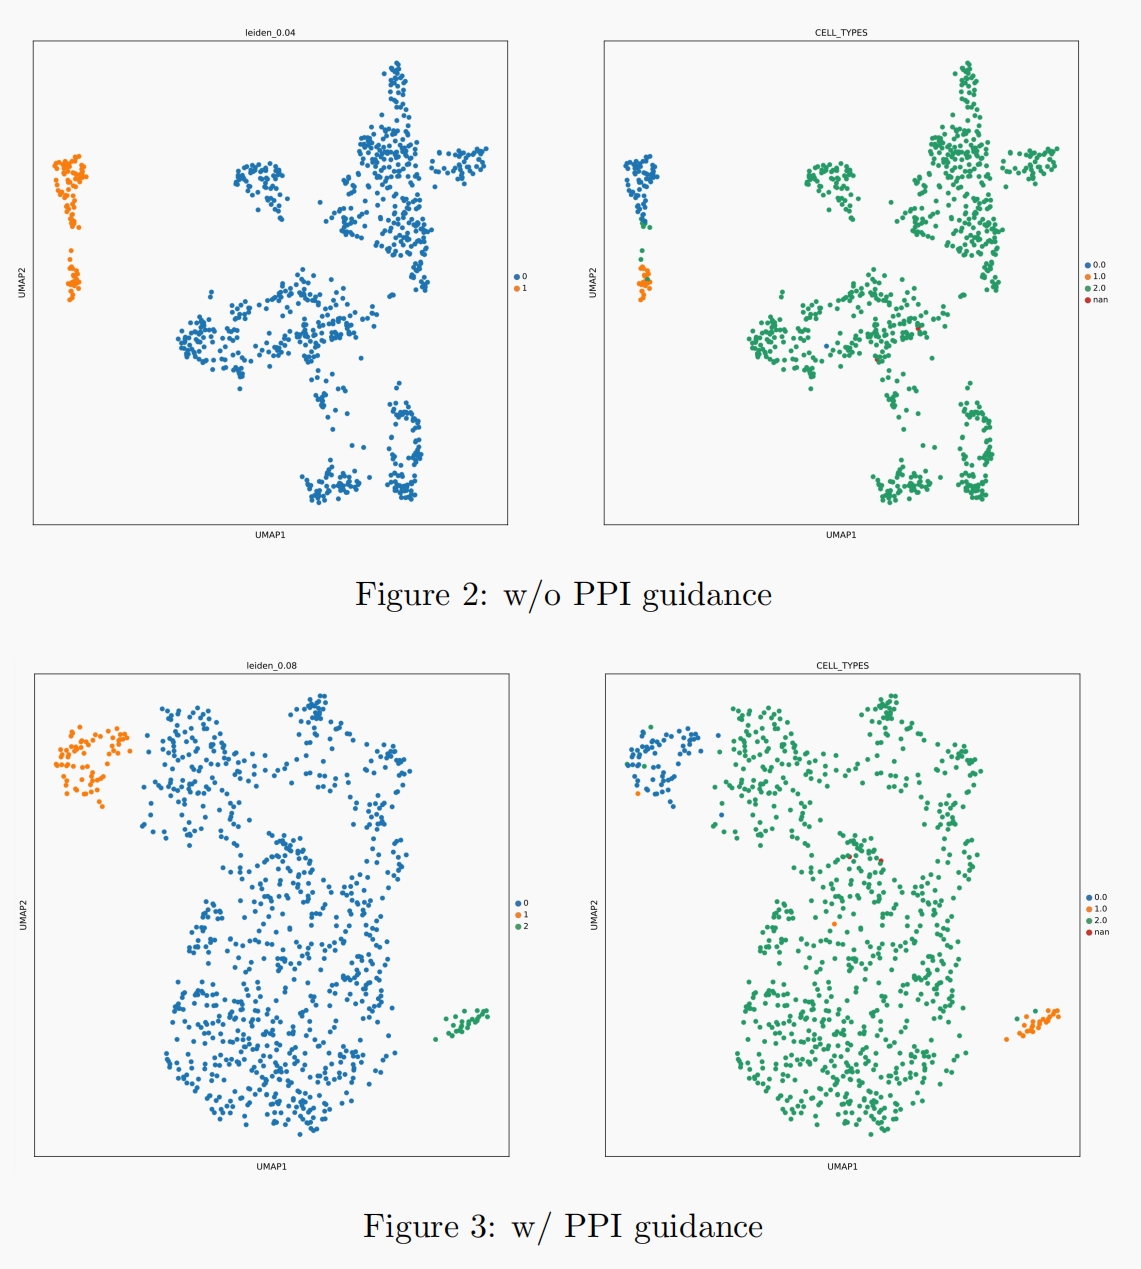
Driver Target Discovery Performance
We evaluate our potential targets on the test set, which is unseen during training and mimics the actual target discovery pipeline. We adopt two metrics as evaluation, namely, root mean square error (RMSE) and Spearman’s rank correlation (Spearman’s r). We use 5 different random seeds for each model to avoid randomness. The results are shown in the Figure, where our/baseline method refers to using the gene embeddings with/without PPI regularization.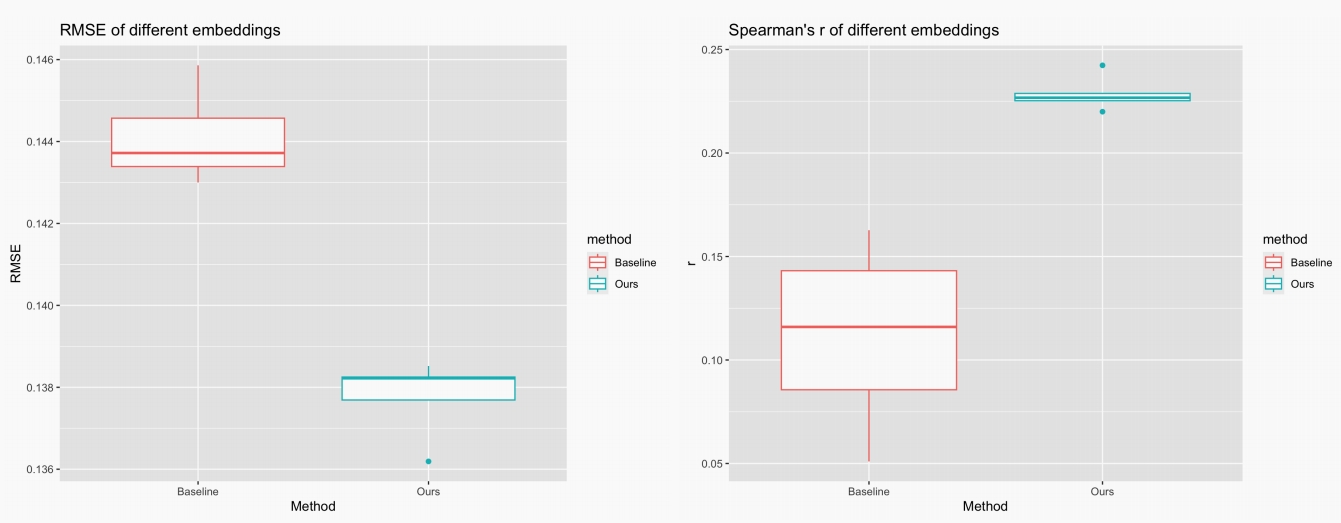
It is shown that our method has lower RMSE and higher Spearman’s r, with much lower variance. We then conduct a two-sample t-test and obtain the p-value of 1.458e-5 and 0.0037 respectively for RMSE and Spearman’s r, which indicates that there are significant improvements of the performance.
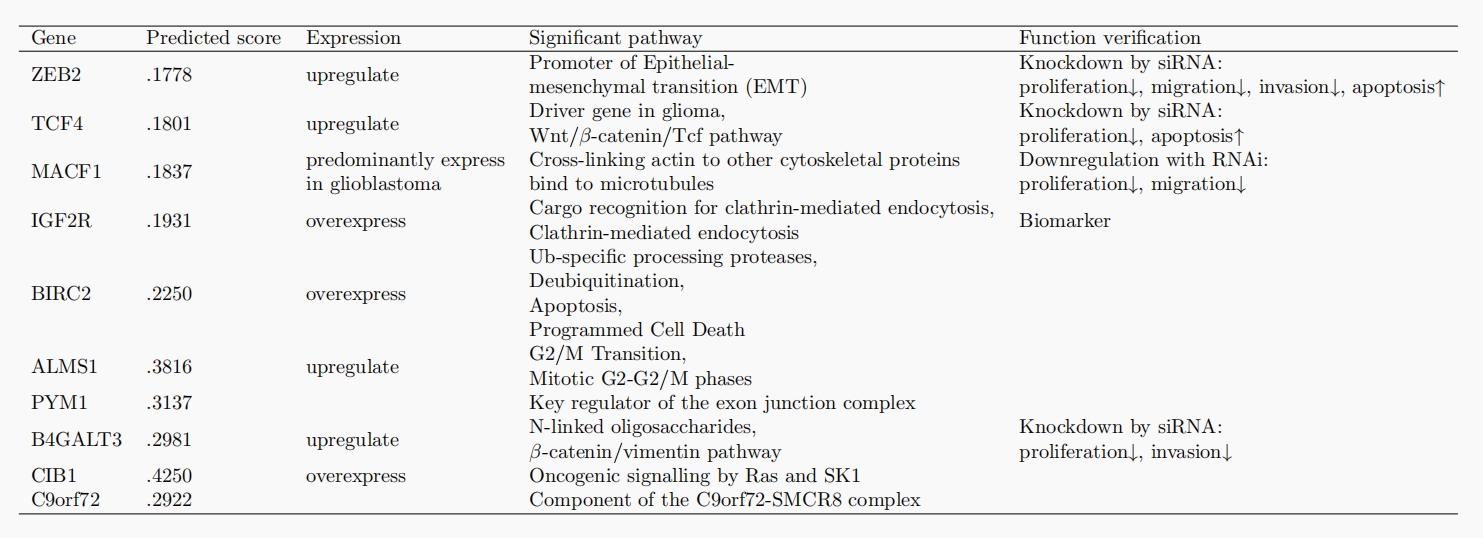
After predicting these genes, how do we determine if these genes are reliable drug targets? From a biological point of view, it is very important to determine whether the protein is expressed differently in tumor tissues than in normal cells, whether some pathways can be identified to prove that it plays a key role in the disease process, and whether there are successful results of functional validation of the genes. We perform pathway analysis to the 10 candidate genes with the highest regression score and we collected some existing experiments (e.g. gene knockout) that verify the functions of the genes. Our findings are organized in the table below.