Wenda Chu, Minsi Lu, Botian Wang, Sihang Zeng, Shiyu Zhao
Repo: Multiomics Integration Via Graph Learning
Introduction
In the evolving landscape of biological research, the advent of advanced sequencing technologies has underscored the significance of multi-omics data to dissect complex biological phenomena comprehensively. By integrating diverse omics datasets, researchers can unravel the intricate interplay among biomolecules, offering a holistic view far beyond what single-omics analyses could achieve. This integration, however, presents its own set of challenges, notably in reconciling matched and unmatched data through various sophisticated methods including latent space inference and nonlinear manifold alignment.
In this project, we focus on the integration of scRNA-seq data and scATAC-seq data through graph learning. Our method is based on GLUE. In this report, we first give an overview of GLUE, and then we introduce our improvements.
Method
Our method is based on GLUE, which is shown in the figure below. GLUE uses matrix factorization to model
the single-cell matrix of each omic. Each matrix is factorized into two vectors, single-cell embedding $U_i$ and omics feature embedding $V_i$, with $i$ indicating the index of certain omics. The cell embeddings are learned directly from the single-cell sequencing matrix, while the feature embeddings are learned from a knowledge based guidance graph through a graph encoder.
The guidance graph is the key to multi-omics integration. In GLUE, the guidance graph is constructed based on the overlap of features on the chromatin. The nodes are thefeatures, e.g., genes or peaks. An edge between two nodes indicates that the corresponding chromatin fragments of the gene and the peak overlap with each other. The graph encoder is a graph convolutional network(GCN) with a simple mean aggregator. We believe that a better guidance graph and a better graph encoder could improve the performance of multi-omics integration, so we refine the model from these two perspectives.
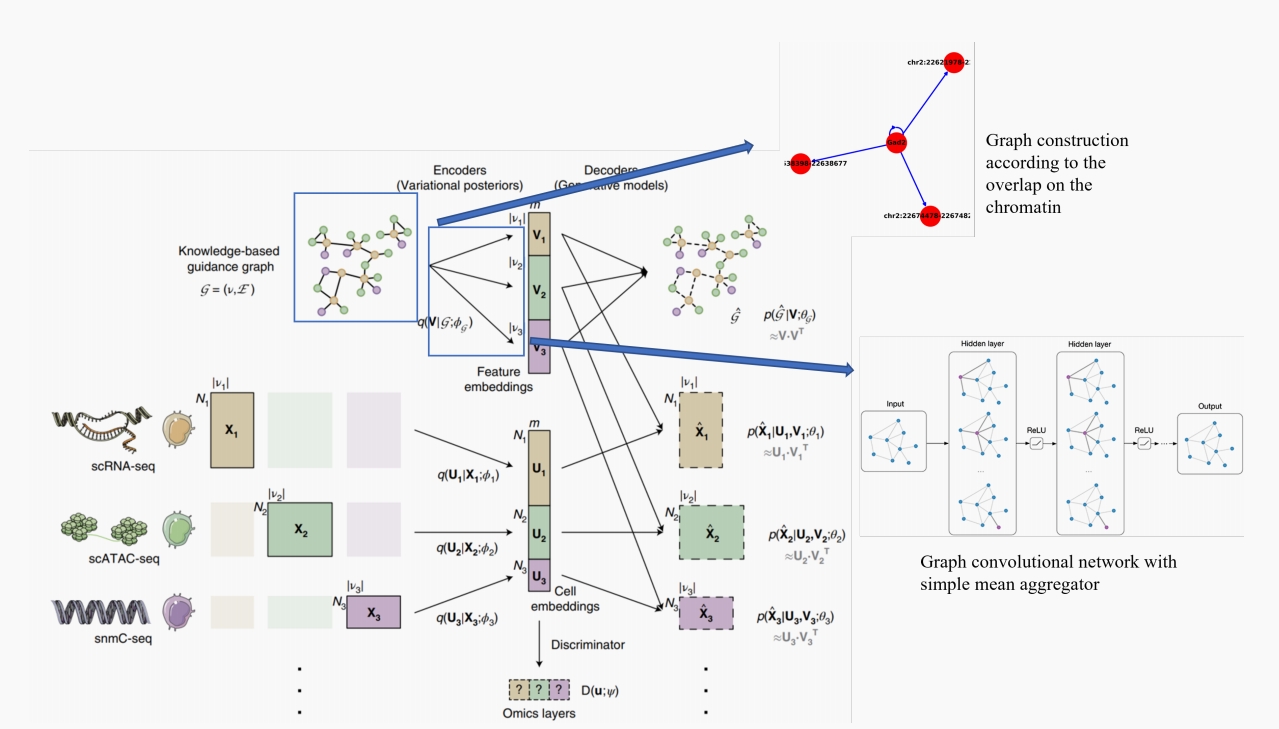
Graph Construction
In the original method, they used genomic overlap simply. So the regulatory relationships inferred using graphs are limited to promoters and gene regions. More information, like cis-regulatory interactions on the upstream and downstream of the gene. CREs are often but not always upstream of the transcription site. CREs are non-coding sequences, but are often co-accessible with genes. They regulate gene transcription by binding TF, and the locationis TF-motif. It is difficult to find information on CREs only from RNA-seq data, but we can infer cellular TF-gene interactions by TF-motif localization. Therefore, it is necessary to expand both upstream and downstream regions of the gene.
Genes are generally in an open state near the transcription start site (TSS), and decay with distance. To simulate real chromatin contact probability, we decay the weight of edges according to the distance of the ATAC peak from the TSS.
We connect ATAC peaks to RNA in the extended region and use a power-law function to decay the weights. For example, take extending the upstream and downstream 150kb of TSS. First, Convert RNA and ATAC data to BED format, locate the TSS and promoters. Second, Build the graph using ’scglue.genomics.window graph’, the weight is
$$ \omega = (\frac{d+1000}{1000})^{-0.75} $$
Finally, We can get the expanded graph with weights.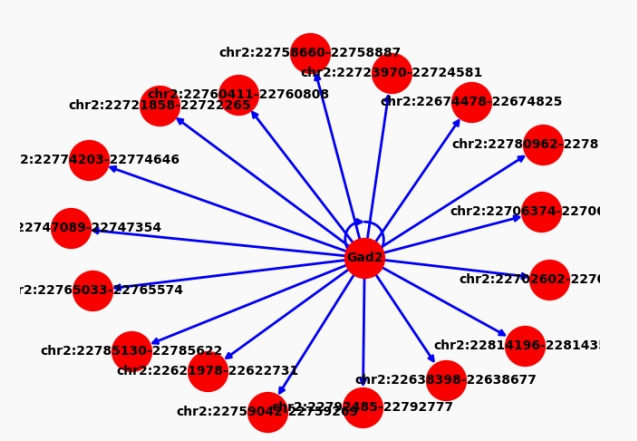
The central node is the gene, and the surrounding node is the ATAC peak.
Graph Encoder
In this section, we introduce our method for aggregating information on the guidance graph, highlighting the limitations of the graph aggregator proposed by previous studies, and presenting a novel aggregation approach based on our observations.
In the original model of GLUE, the authors use GCN, a commonly used graph neural network, to encode the guidance graph. The following is a typical form for GNN,
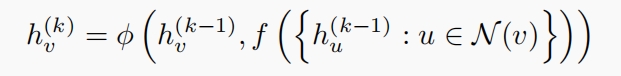
$f$: the aggregator to aggregate neighborhood information into message,
$\phi$: the combinator to combine the updated the message from neighborhoods with the target node. As for GCN, $f$ is the MEAN aggregator, that is,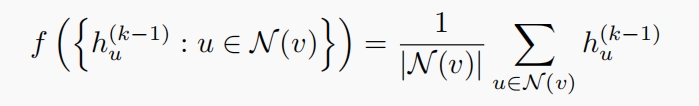
Indistinguishability in Single Aggregator
The original GLUE model employs a Graph Convolutional Network (GCN) to encode the guidance graph, using a MEAN aggregator to combine information from neighboring nodes. However, this approach has limitations in expressiveness, losing structural information in encoded graphs. We illustrate this issue with an example where a MEAN aggregator cannot distinguish between two graphs representing different biological scenarios due to its inability to capture the unique contributions of individual nodes.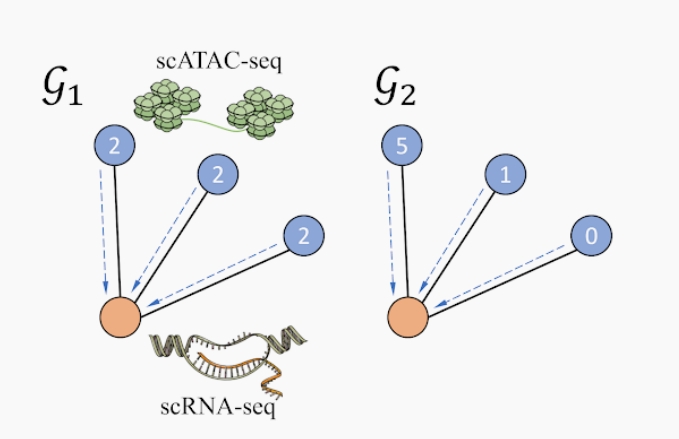
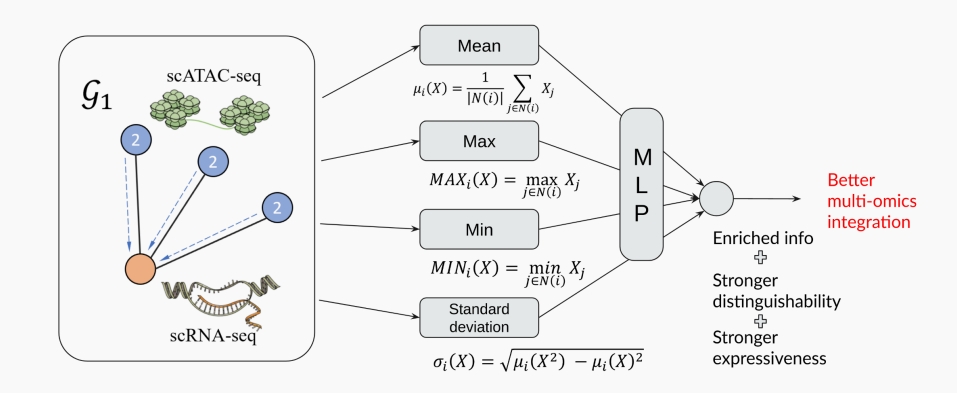
GCN with Principal Neighborhood Aggregation (PNA)
To address the limitations of a single aggregator, we propose the use of Principal Neighborhood Aggregation (PNA), which incorporates multiple aggregators in the graph encoding process. This method enhances the graph encoder’s ability to preserve biological information by utilizing a set of independent aggregators in each GCN layer, thereby achieving better distinguishability for guidance graphs.
The PNA approach is defined as follows: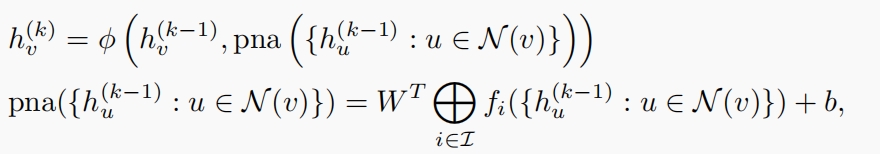
where ${f_i, i \in I}$ represents a set of predefined aggregators, including Mean, Max, Min, and standard deviation. This diverse set of aggregators allows for a richer representation of the guidance graph’s structure, significantly improving the model’s ability to guide multi-omics integration with enhanced fidelity to biological information.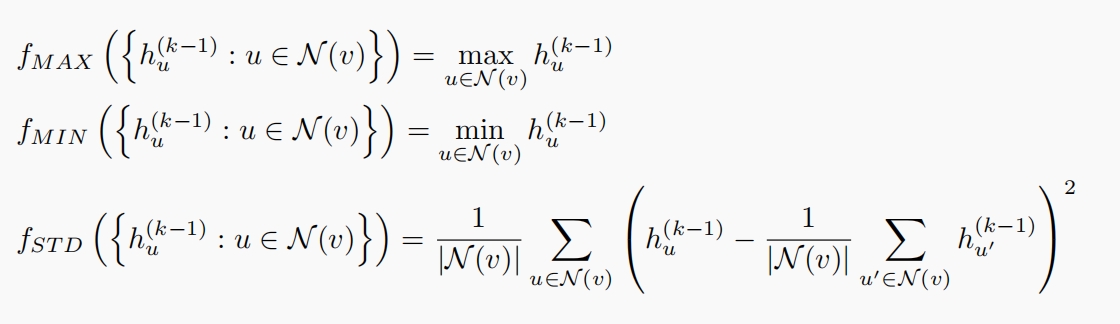
Results
We present the experimental results of our framework in two downstream applications: Cell Integration and Regulatory Inference, which are two typical applications for multiomics integration frameworks.
Cell Integration
Cell integration intends to make use of the cell encoders to embed the sequencing data from different cell types and omics into a shared latent space. Effective multiomics integration methods should simultaneously distinguish different cell types and align the distinctive omics layers (the scATAC-seq and scRNA-seq in our setting). We adopt six metrics used in GLUE to evaluate the performance of cell integration.
The metrics can be classified into two types:
(1) Biological conservation metrics that evaluate the resolution of clustered cell types, including Average Silhouette Width, Normalized Mutual Information, and Mean Average Precision. Higher scores will be assigned for clustering results that successfully distinguish the different cell types.
(2)
Omics mixing metrics that measure the extent that different omics layers are mixed together, including Graph Connectivity, Average Silhouette Width Batch, and Seurat Alignment Score. Higher scores will be given if the scATAC-seq and scRNA-seq are evenly distributed in the latent embedding space. For brevity, we omit the mathematical formulations of the metrics, which can be found in the GLUE paper.
We compare these metrics across three model variants:
- GLUE is the model presented in the original GLUE paper.
- GLUE+PNA leverages multiple aggregators when encoding the guidance graph.
- GLUE+PNA+Decay further modifies the guidance graph to incorporate more gene-ATAC peak relationships.
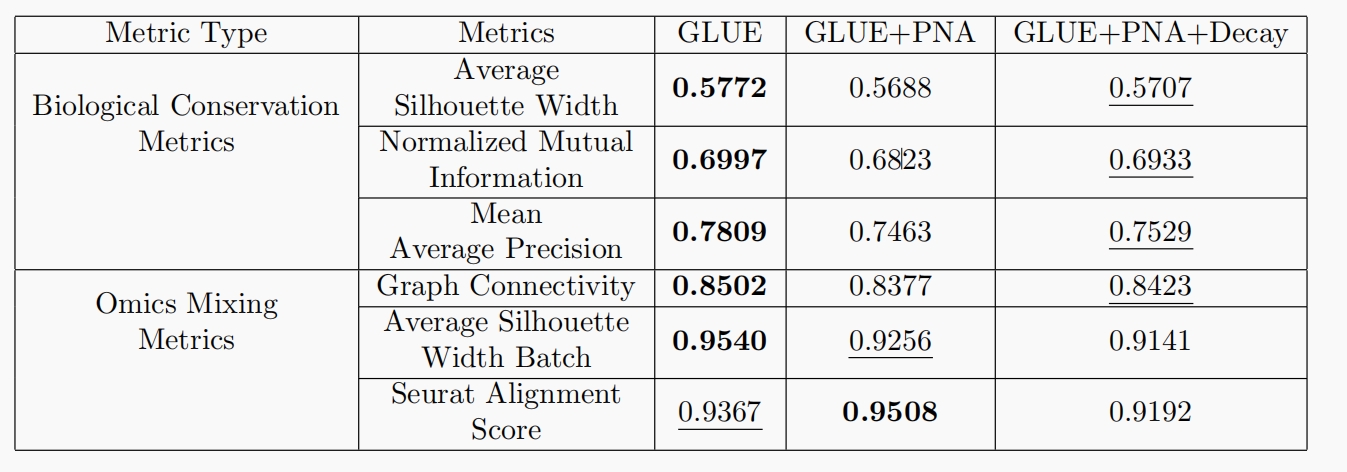
The overall performance is summarized in Table 1. Firstly, despite that for all metrics except Seurat Alignment Score, the original GLUE model still achieves the best results, our methods still perform comparatively. We hypothesize that our efforts are targeted at the construction and encoding of the prior guidance graph, which shall naturally lead to improvements of the node features rather than the cell features. However, only cell features are utilized in the cell integration process. Hence, we cannot see significant improvements of the related metrics. We will discuss more benefits of our methods in the Regulatory Inference Section. Secondly,
when comparing the two variants of our model, we can see that GLUE+PNA+Decay outperforms GLUE+PNA
in all biological conservation metrics. It may be credited to the additional prior knowledge introduced by the augmented gene-ATAC graph, which contributes to the bettered biological soundness of the cell features.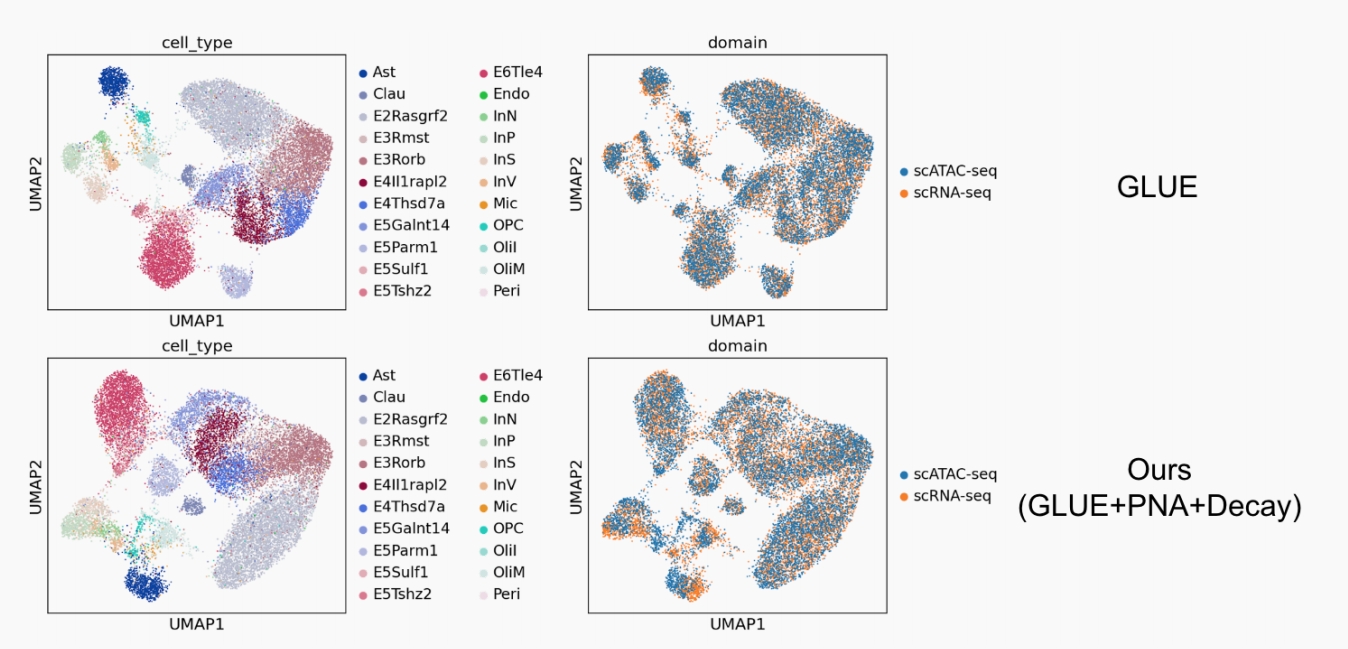
Regulatory Inference
Another important application of the multiomics integration framework is integrative regulatory inference. Following the GLUE pipeline, we first extract a directed non-cyclic skeleton graph with high-variant genes and ATAC peaks as nodes from the constructed guidance graph, on which we mine the regulatory relationships.
Then, we use the trained embeddings of the gene and ATAC peak features as node features. We calculate the cosine similarity of the features to obtain the regulatory scores, which are compared to a null distribution and are each assigned a significant score. The edges receiving significant regulatory scores are extracted as valid regulation relationships.
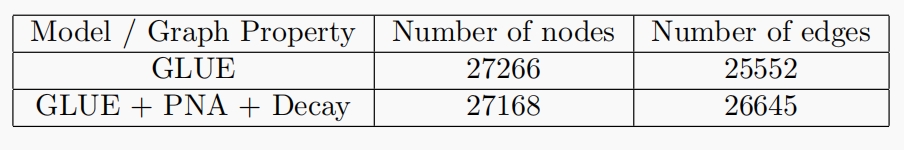
We then conduct a qualitative analysis on the mined regulatory graph. Firstly, as shown in the table below. We notice that around 1100 more relationships are extracted in our regulatory graph. Moreover, we found 41 genes uniquely appearing in our regulation graph, including important protein encoding genes such as CtsW, Bola1 and Figla. Furthermore, we examined that the weights related to the 41 gene nodes are relatively low, which confirms that they are relevant to the decayed edges we constructed in the extended region of the guidance graph. These findings demonstrate the strengths of our methods in finding richer regulatory relationships compared to the vanilla GLUE framework. Note that we could also combine the extracted gene-peak edges with the public peak-TF Motif data to form gene-TF regulation network, which is of more biological significance.